mpociot/cockpit
Cockpit
Custom widgets for your Laravel app


Easy to use widgets with custom metrics, filters and drag and drop support.
Note: Documentation is still in progress.
Contents
## InstallationIn order to install Cockpit, just add
"mpociot/cockpit": "~1.0"
to your composer.json. Then run composer install or composer update.
(or run composer require mpociot/cockpit if you prefere that)
Then in your config/app.php add
Mpociot\Cockpit\CockpitServiceProvider::class
in the providers array.
Next, publish Cockpit's views, javascript files and migration and run the migrate command.
php artisan vendor:publish --provider="Mpociot\Cockpit\CockpitServiceProvider"
php artisan migrate
After you've published all the needed assets and created the widgets table through the Cockpit migration, you're good to go.
Cockpit comes with some preconfigured routes, so go ahead and visit: http://your.app/cockpit/.
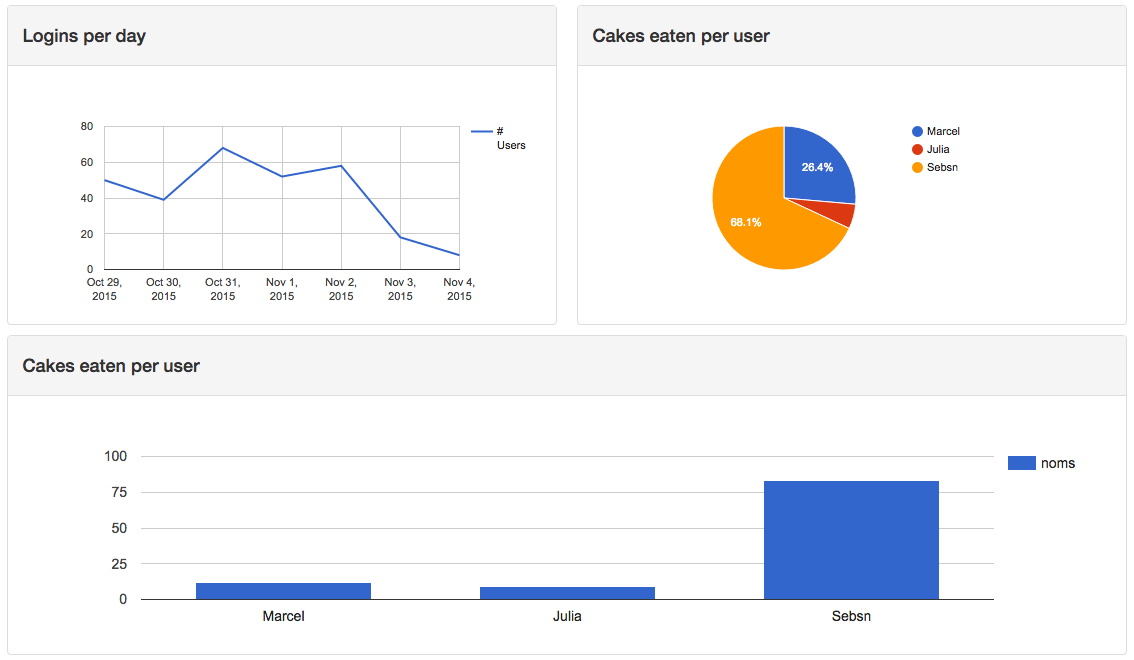
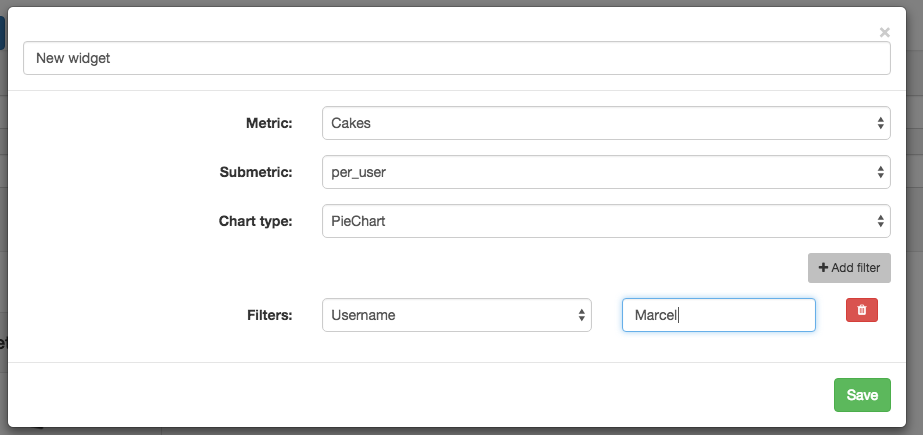
This is your "dashboard" which allows you to create custom widgets that will query your application and show some nice charts.
### How does it work?When you add a new widget, Cockpit will look in a configurable folder for all available metrics your app could define. Each metric can have multiple sub-metrics that can be queried and those sub-metrics are filterable.
Example to make the concept easier to understand:
Your app logs all logins. On your dashboard, you want to be able to show a widget that displays:
- All logins grouped by "time" (this could be day, week, month, year)
- All logins grouped by specific users
In this case, your metric would be Logins that has two submetrics named per_time and per_user.
Cockpit ships a simple Users metric, which will be copied to this directory: app/Cockpit/Metrics.
If your app is running in a different namespace or you want to change the path of your custom metrics, modify the appropriate values in the config/cockpit.php file.
The base structure of a metric is:
use Mpociot\Cockpit\Metric;

class Logins extends Metric
{
	// Visible name when selecting the metric in the UI
	protected $name = "My Metric";

	// Define all submetrics and which charts are available for each submetric
	protected $allowedSubMetrics = [
        'per_user' => ['LineChart','ColumnChart','PieChart'],
    ];

    // Define all filters that can be applied to this metric
    protected $allowedFilters = [
        'username' => [
            'type' => 'text',
            'name' => 'Username'
        ]
    ];

	/**
	 * Implement date filter functionality.
	 * This is needed for all metrics, as the time filter is always available
	 */
    protected function filterFromDate($query, $value)
    {
        return $query->where("created_at" , ">", $value);
    }

    protected function filterUntilDate($query, $value)
    {
        return $query->where("created_at" , "<=", $value);
    }

    /**
     * Implement your custom submetrics
     */
     public function calculatePerUser($filters = [])
    {
		// Use this Eloquent model for all queries
        $query = \App\Models\Login::query();

		// Apply each filter method on the query object
        $query = $this->applyFilters($query, $filters);

		// Get the results we need to display
        $results = $query
	        ->groupBy("username")
	        ->get([
                DB::raw('username, COUNT(*) AS `count`')
            ]);

		// Define the columns our chart will have
        $this->dataTable
        		->addStringColumn("Username")
            	->addNumberColumn("Num Logins");

		// Add the database results to our chart
        foreach ($results as $result) {
            $this->dataTable->addRow([
           	   $result->username,
                $result->count
            ]);
        }

        return $this->dataTable;
    }

     /**
     * Implement your custom filters
     */
	protected function filterUsername($query, $value)
    {
        return $query->where("username",$value);
    }

}
Not documented yet :(
### Available chart types- Line Chart
- Area Chart
- Bar Chart
- Column Chart
- Pie Chart
- Donut Chart
- Geo Chart
- Calendar Chart
- Gauge Chart
For further information about how the DataTable API / Chart API works, please take a look at Lavacharts.
## Licensecockpit is free software distributed under the terms of the MIT license.