| Package Data | |
|---|---|
| Maintainer Username: | Laraveldaily |
| Maintainer Contact: | povilas@laraveldaily.com (Povilas Korop) |
| Package Create Date: | 2019-02-17 |
| Package Last Update: | 2023-10-23 |
| Language: | PHP |
| License: | MIT |
| Last Refreshed: | 2026-03-12 03:13:15 |
| Package Statistics | |
|---|---|
| Total Downloads: | 438,625 |
| Monthly Downloads: | 5,816 |
| Daily Downloads: | 238 |
| Total Stars: | 554 |
| Total Watchers: | 21 |
| Total Forks: | 118 |
| Total Open Issues: | 24 |
Package to generate Chart.js charts directly from Laravel/Blade, without interacting with JavaScript.
Notice: Package is in early development, generating simple cases, so it's likely that syntax/parameters will change with future versions, use with cautions.
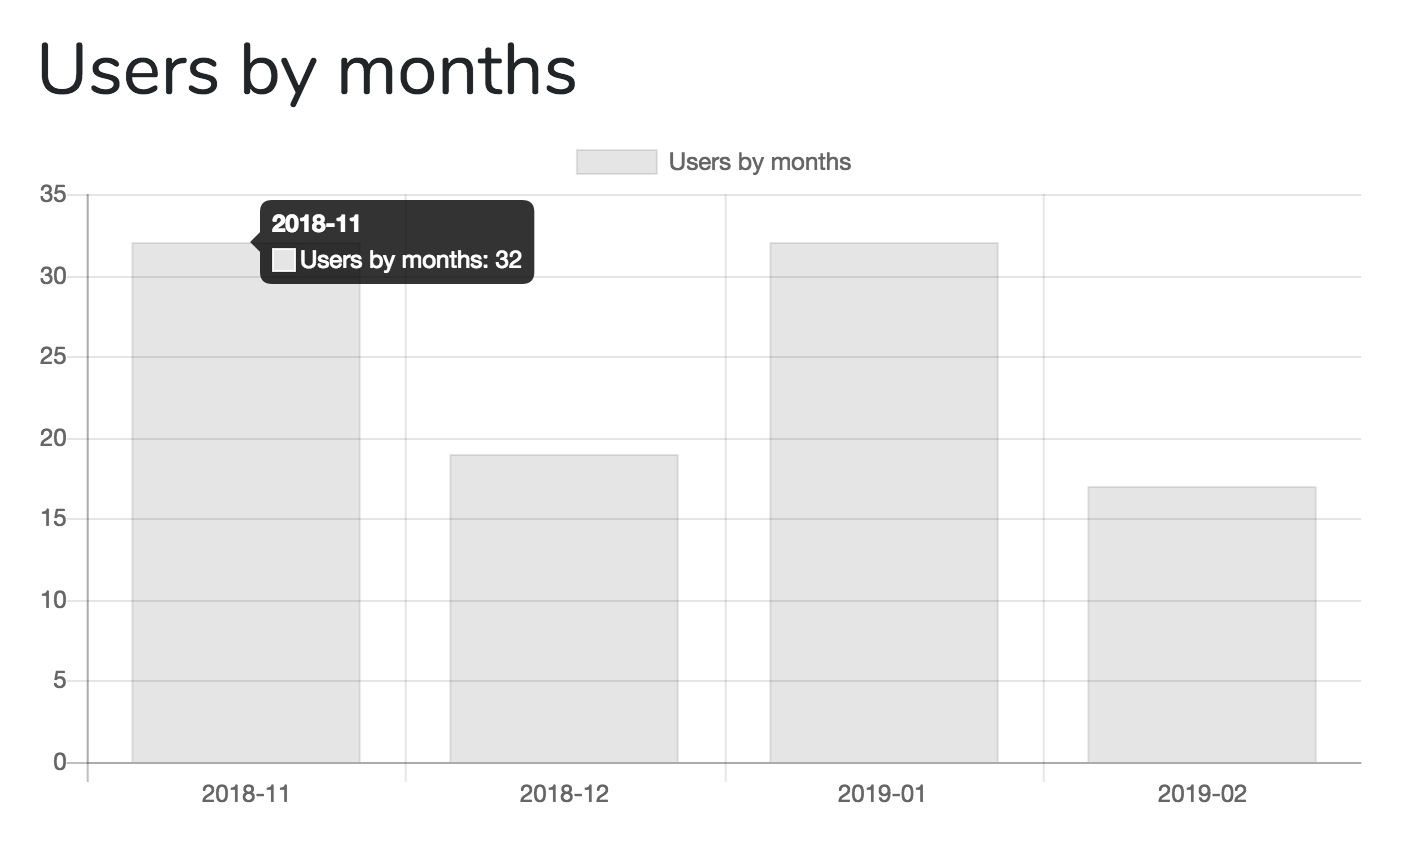
If you want to generate a chart above, grouping users records by the month of created_at value, here's the code.
Controller:
use LaravelDaily\LaravelCharts\Classes\LaravelChart;

// ...

$chart_options = [
    'chart_title' => 'Users by months',
    'report_type' => 'group_by_date',
    'model' => 'App\User',
    'group_by_field' => 'created_at',
    'group_by_period' => 'month',
    'chart_type' => 'bar',
];
$chart1 = new LaravelChart($chart_options);

return view('home', compact('chart1'));
View File
@extends('layouts.app')

@section('content')
<div class="container">
    <div class="row justify-content-center">
        <div class="col-md-8">
            <div class="card">
                <div class="card-header">Dashboard</div>

                <div class="card-body">

                    <h1>{{ $chart1->options['chart_title'] }}</h1>
                    {!! $chart1->renderHtml() !!}

                </div>

            </div>
        </div>
    </div>
</div>
@endsection

@section('javascript')
{!! $chart1->renderChartJsLibrary() !!}
{!! $chart1->renderJs() !!}
@endsection
composer require laraveldaily/laravel-charts
No additional configuration or other parameters yet.
You need to create LaravelChart object in your Controller, passing array of options.
$chart = new LaravelChart($options);
Then pass it to the View, as a variable:
return view('dashboard', compact('chart'));
Currently package support two types of charts/reports:
group_by_date - amount of records from the same table, grouped by time period - day/week/month/year;group_by_string - amount of records from the same table, grouped by any string field, like name;group_by_relationship - amount of records from the same table, grouped by belongsTo relationship's fieldExample with all options
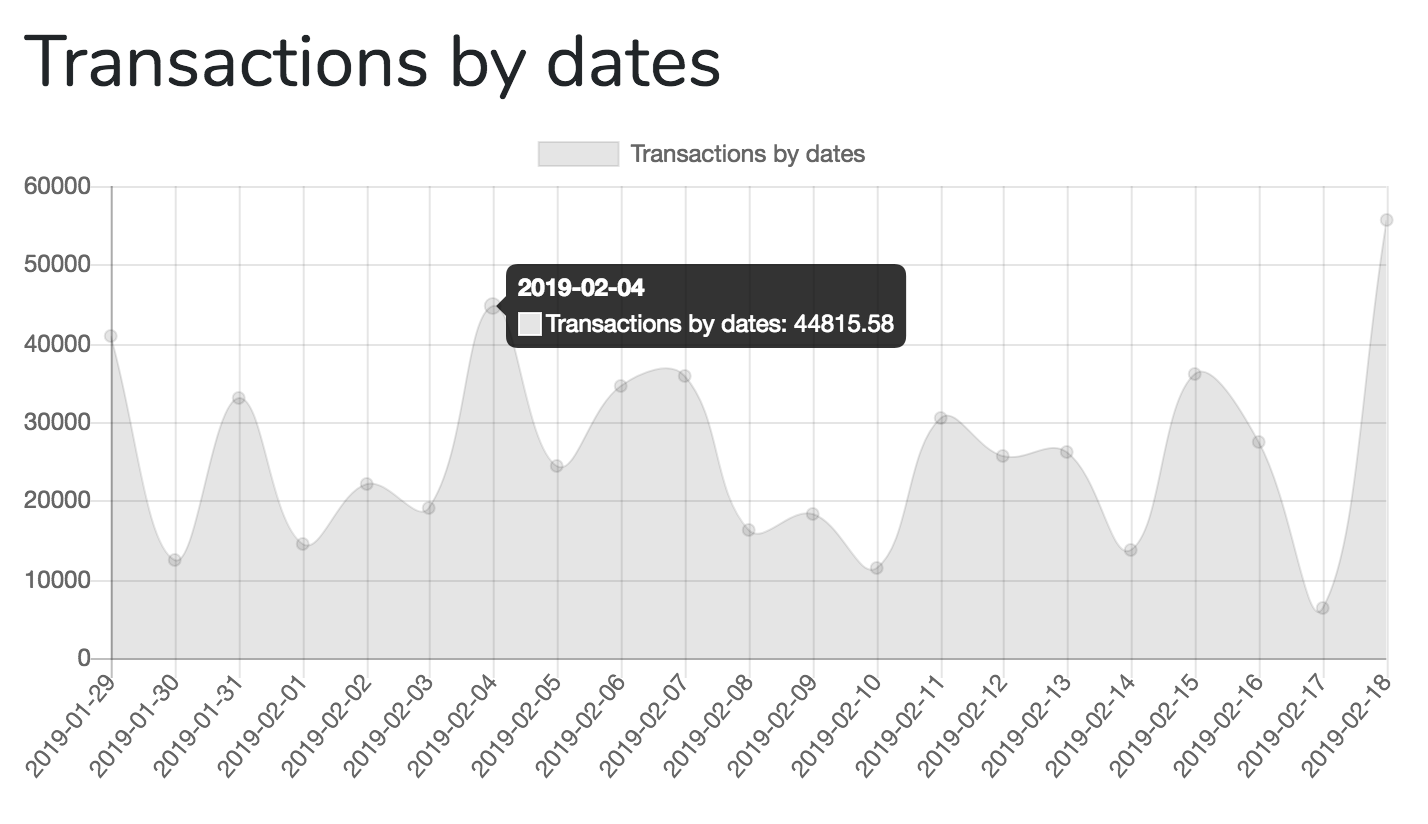
$chart_options = [
    'chart_title' => 'Transactions by dates',
    'chart_type' => 'line',
    'report_type' => 'group_by_date',
    'model' => 'App\Transaction',

    'group_by_field' => 'transaction_date',
    'group_by_period' => 'day',

    'aggregate_function' => 'sum',
    'aggregate_field' => 'amount',

    'filter_field' => 'transaction_date',
    'filter_days' => 30, // show only transactions for last 30 days
    'filter_period' => 'week', // show only transactions for this week
    'continuous_time' => true, // show continuous timeline including dates without data
];
chart_title (required) - just a text title that will be shown as legend;chart_type (required) - possible values: "line", "bar", "pie";report_type (required) - see above, can be group_by_date, group_by_string or group_by_relationship;model (required) - name of Eloquent model, where to take the data from;group_by_field (required) - name of database field that will be used in group_by clause;group_by_period (optional, only for group_by_date report type) - possible values are "day", "week", "month", "year";relationship_name (optional, only for group_by_relationship report type) - the name of model's method that contains belongsTo relationship.aggregate_function (optional) - you can view not only amount of records, but also their SUM() or AVG(). Possible values: "count" (default), "avg", "sum".aggregate_field (optional) - see aggregate_function above, the name of the field to use in SUM() or AVG() functions. Irrelevant for COUNT().filter_field (optional) - show only data filtered by that datetime field (see below)filter_days (optional) - see filter_field above - show only last filter_days days of that field. Example, last 30 days by created_at field.filter_period (optional) - another way to filter by field, show only record from last week / month / year. Possible values are "week", "month", "year".continuous_time (optional) - show all dates on chart, including dates without data.$chart_options = [
'chart_title' => 'Transactions by user',
'chart_type' => 'line',
'report_type' => 'group_by_relationship',
'model' => 'App\Transaction',
'relationship_name' => 'user', // represents function user() on Transaction model
'group_by_field' => 'name', // users.name
'aggregate_function' => 'sum',
'aggregate_field' => 'amount',
'filter_field' => 'transaction_date',
'filter_days' => 30, // show only transactions for last 30 days
'filter_period' => 'week', // show only transactions for this week
];
Notice: currently package is in early version, so these parameters may change in the future.
After you passed $chart variable, into Blade, you can render it, by doing three actions:
Action 1. Render HTML.
Wherever in your Blade, call this:
{!! $chart1->renderHtml() !!}
It will generate something like this:
<canvas id="myChart"></canvas>
Action 2. Render JavaScript Library
Package is using Chart.js library, so we need to initialize it somewhere in scripts section:
{!! $chart1->renderChartJsLibrary() !!}
It will generate something like this:
<script src="https://cdnjs.cloudflare.com/ajax/libs/Chart.js/2.5.0/Chart.min.js"></script>
Action 3. Render JavaScript of Specific Chart
After Chart.js is loaded, launch this:
{!! $chart1->renderJs() !!}
You can show multiple charts on the same page, initialize them separately.
Controller:
public function index()
{
$chart_options = [
'chart_title' => 'Users by months',
'report_type' => 'group_by_date',
'model' => 'App\User',
'group_by_field' => 'created_at',
'group_by_period' => 'month',
'chart_type' => 'bar',
'filter_field' => 'created_at',
'filter_days' => 30, // show only last 30 days
];
$chart1 = new LaravelChart($chart_options);
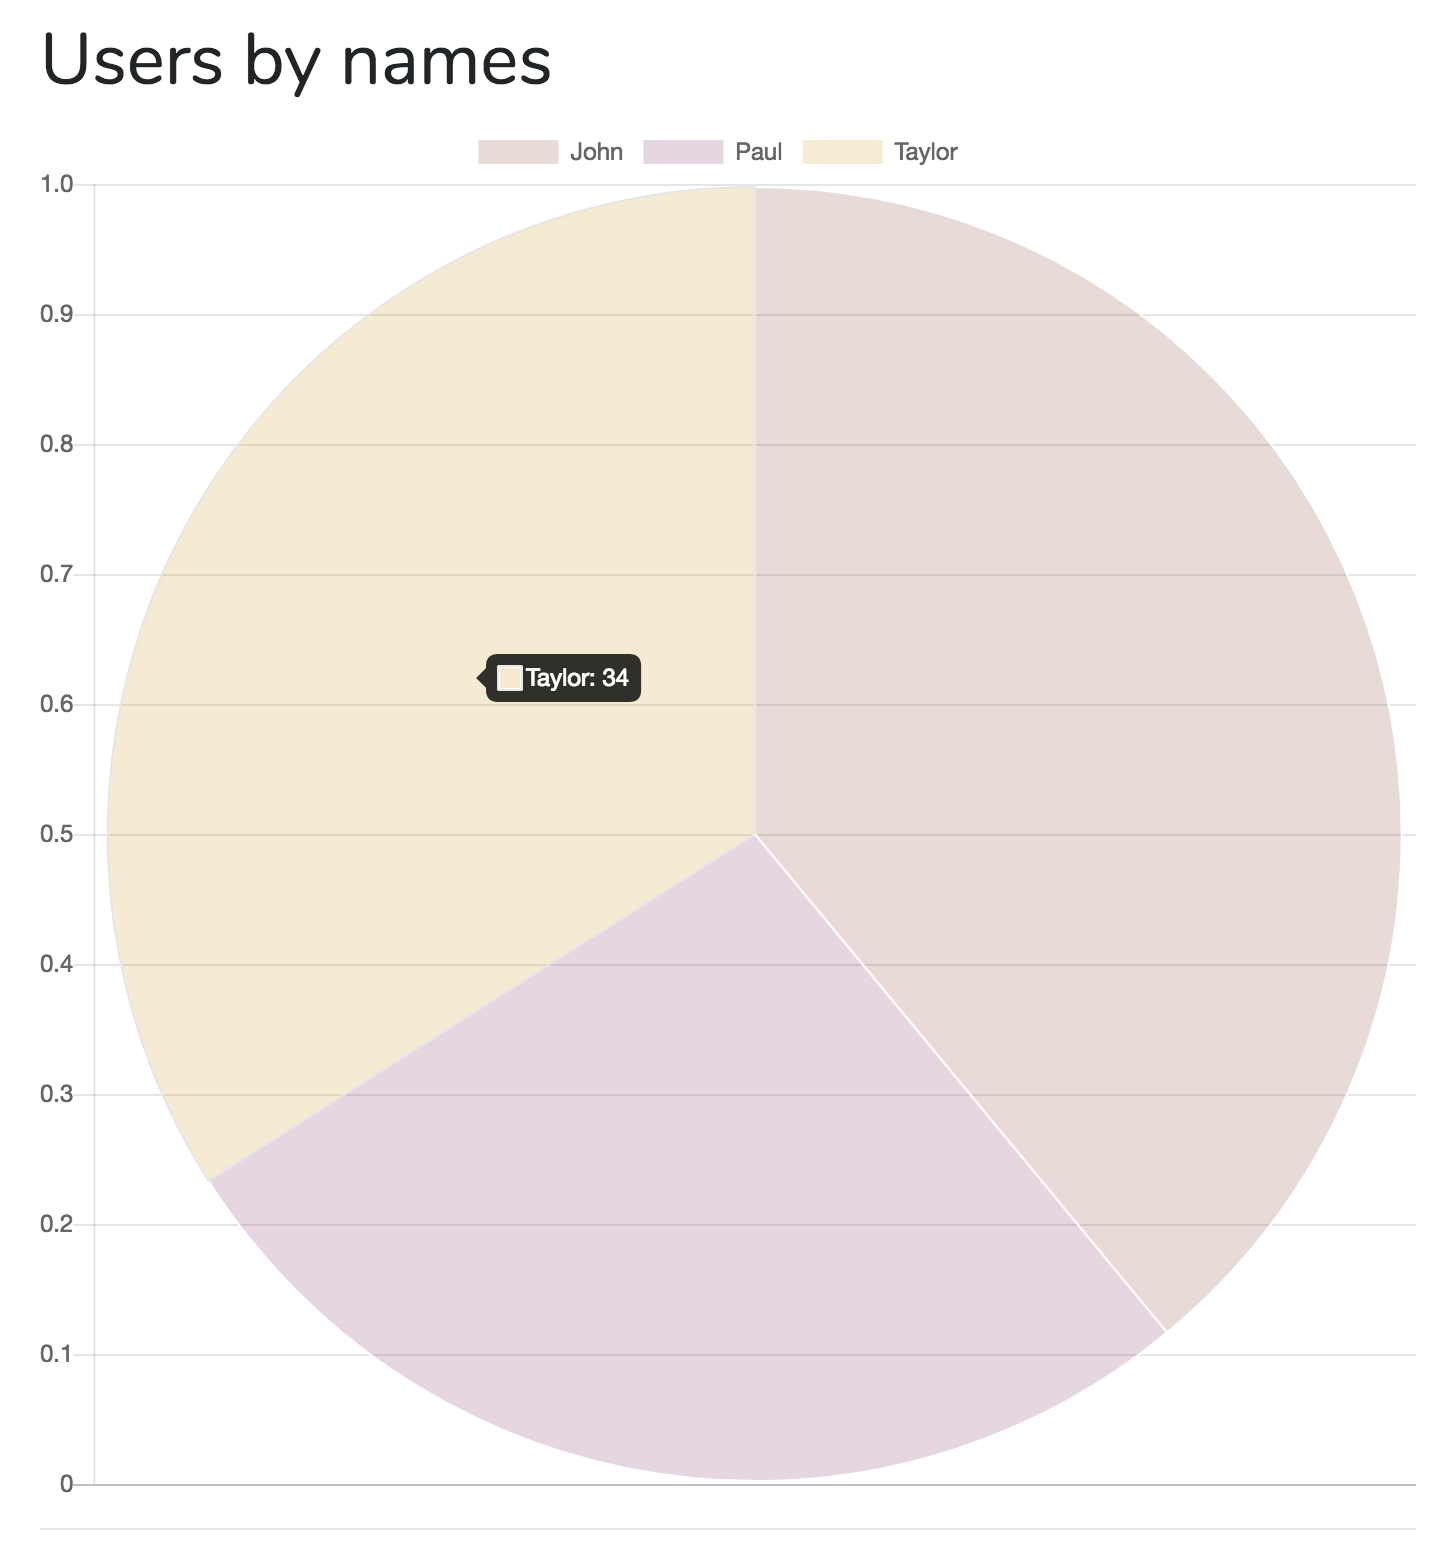
$chart_options = [
'chart_title' => 'Users by names',
'report_type' => 'group_by_string',
'model' => 'App\User',
'group_by_field' => 'name',
'chart_type' => 'pie',
'filter_field' => 'created_at',
'filter_period' => 'month', // show users only registered this month
];
$chart2 = new LaravelChart($chart_options);
$chart_options = [
'chart_title' => 'Transactions by dates',
'report_type' => 'group_by_date',
'model' => 'App\Transaction',
'group_by_field' => 'transaction_date',
'group_by_period' => 'day',
'aggregate_function' => 'sum',
'aggregate_field' => 'amount',
'chart_type' => 'line',
];
$chart3 = new LaravelChart($chart_options);
return view('home', compact('chart1', 'chart2', 'chart3'));
}
View:
@extends('layouts.app')

@section('content')
<div class="container">
    <div class="row justify-content-center">
        <div class="col-md-8">
            <div class="card">
                <div class="card-header">Dashboard</div>

                <div class="card-body">

                    <h1>{{ $chart1->options['chart_title'] }}</h1>
                    {!! $chart1->renderHtml() !!}

                <hr />

                    <h1>{{ $chart2->options['chart_title'] }}</h1>
                    {!! $chart2->renderHtml() !!}

                    <hr />

                    <h1>{{ $chart3->options['chart_title'] }}</h1>
                    {!! $chart3->renderHtml() !!}

                </div>

            </div>
        </div>
    </div>
</div>
@endsection

@section('javascript')
{!! $chart1->renderChartJsLibrary() !!}

{!! $chart1->renderJs() !!}
{!! $chart2->renderJs() !!}
{!! $chart3->renderJs() !!}
@endsection
The MIT License (MIT). Please see License File for more information.